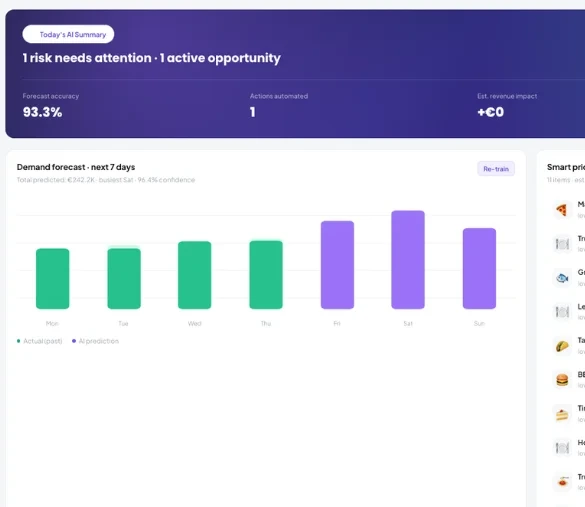
Kappino’s restaurant analytics software gives European restaurants a live view of the metrics that matter — from sales and food costs to labour, waste and customers. No spreadsheets. Just clarity.
What Is Restaurant Analytics — And Why Does Every European Restaurant Need It?
Restaurant analytics is the practice of collecting, measuring, and interpreting operational data to make faster, smarter business decisions — whether you run a single bistro in Berlin or a multi-location group across the UK and Spain.
The Problem: Running on Gut Feel Is Costing You Money. Most European restaurant operators still rely on weekly spreadsheets, disconnected POS exports, and end-of-month accountant reports. By the time the data reaches you, the opportunity to act is gone.
With Kappino, your restaurant data becomes a live decision system — helping you understand sales, food costs, staffing, waste and branch performance before small issues become expensive problems.
Everything You Need to Analyse, Optimise, and Grow
Kappino’s restaurant reporting software bundles every critical analytics module into one connected platform — so your entire operation speaks the same data language.
Real-Time Sales Analytics
Monitor revenue, orders, average order value and gross profit for today, this week, this month, this quarter or any custom range, with hourly sales, channel mix and your top-selling items.
Revenue, orders & average order value
Channel mix & top items
Peak sales hours identification
Food Cost & P&L Analysis
Track cost of goods sold, gross profit and recipe margins, and see your real profit after expenses and labour on the Expenses dashboard.
COGS % & monthly purchasing
Recipe cost & margin per dish
Net profit after expenses and labour
Inventory & Waste Analytics
Stop over-ordering and make waste visible. AI Inventory analytics show waste by reason, overstock and dead stock, items expiring soon and the price history of every item.
Waste by reason & value written off
Overstock & dead stock
Stock value per branch
Staff & Labour Performance
Link revenue to your team. The Operations report shows orders served, revenue and average ticket per staff member, and Workforce AI tracks labour against sales.
Orders & revenue per staff member
Labour % of sales against target
Four-week labour cost forecast
Guest & CRM Analytics
Understand your customers: order counts and lifetime value per customer, segment counts, and loyalty programme metrics such as members per tier and redemptions.
Orders & lifetime value per customer
Customer segments
Loyalty programme metrics
Multi-Location & Branch Analytics
Running several sites? See each branch’s revenue and orders today, switch between branches or view them all, and compare branches on revenue, expenses and net profit.
Live stats per branch
Branch comparison on the Expenses dashboard
Ask Pino AI to compare branches
Saved Reports
Save Finance, Sales, Operations and Customer reports, run them whenever you need them, and download them as PDF.
Date-range & branch filtering
PDF download
Forecast and labour data as CSV
Visual Dashboards
View key metrics at a glance with interactive charts and real-time KPI tracking that gives you a live business overview.
Real-time KPI tracking
Growth trend graphs
Live business overview
Ask Pino AI
Ask Kappino’s AI assistant about sales, orders, stock, staff or branches in plain language and get the answer as KPI cards, tables and charts, with sources.
Answers in 5 languages
Respects each user’s role
Follow-up suggestions
Know Exactly Which Menu Items Are Making or Losing You Money
Every order you take becomes data. Kappino turns it into clear sales intelligence — gross profit, top items, channel mix and the cost and margin of every dish.
Turn POS Data into Profit Decisions
Kappino helps restaurant operators move beyond basic sales totals and understand which dishes and channels are actually driving profit. Recipe costing shows the margin of every dish, and the menu engineering matrix in AI Smart Pricing sorts your items into Stars, Plow Horses, Puzzles and Dogs — so your team can promote high-margin winners, rethink weak dishes and plan menus with confidence.
What Restaurant Analytics Helps You Monitor
Use connected reporting to monitor the numbers that matter every day.
Sales, orders and average order value by period
Peak hours and top-selling items
Food cost, gross profit and net profit
Waste, overstock and expiring stock
Labour cost against sales
Branch performance side by side
Built for Europe’s Strictest Data Privacy Standards
Kappino provides privacy-focused controls for restaurant data and operational records, designed to support applicable Swiss and European data protection requirements.
European Compliance Framework
Kappino’s core platform infrastructure is hosted in Switzerland with Infomaniak, with data protection practices designed to support Swiss FADP and applicable EU GDPR requirements.
Self-service data export and account deletion from Settings.
Granular role-based permissions across 30 modules so staff only see what they need.
Audit trail of key actions, plus device and session management.
Designed with privacy-focused controls for European restaurant operations.
Encrypted third-party connection tokens and signed backups.
Kappino packages
Simple pricing for every restaurant stage.
Choose the package that fits your restaurant operations and business needs.
Starter
Essential tools for small restaurants, cafés, and single-location businesses.
Prices are for business customers and exclude VAT and other applicable taxes, which are shown on your invoice. Prices per month. Final pricing may vary depending on setup, integrations, support requirements and business needs. Not sure which plan fits? Book a personalised demo
Restaurant Analytics Software FAQs
What is restaurant analytics software and how does it work?
Restaurant analytics software turns your operational data into dashboards, reports and alerts. Because Kappino runs your POS, orders, inventory, staff, expenses and customers, the data is already in one place — Kappino organises it into live dashboards, saved reports and AI answers about sales, food costs, labour and customers, so you can act on information, not assumptions.
How does Kappino restaurant analytics handle GDPR for European operators?
Kappino’s core platform infrastructure is hosted in Switzerland with Infomaniak, with data protection practices designed to support Swiss FADP and applicable EU GDPR requirements. Available privacy controls and contractual arrangements depend on the configured service and customer requirements.
Does Kappino support multi-location restaurant groups?
Yes. Kappino scales from a single restaurant to a multi-branch group. You can switch between branches or view them all, see each branch’s revenue and orders today, compare branches on revenue, expenses and net profit, and ask Pino AI to compare branches for you.
How long does it take to set up Kappino analytics?
Analytics work from the data you create in Kappino, so they start filling as soon as you take orders. The Quick Setup wizard guides you through nine steps — language and country, business, branches, menu, suppliers, inventory, tables, riders and staff — with CSV templates for bulk import.
Can I generate custom reports for specific time periods or branches?
Yes. Choose today, this week, month or quarter, or a custom date range, for one branch or all of them. Save Finance, Sales, Operations or Customer reports to run whenever you need them and download them as PDF. Forecast and labour data can also be exported as CSV.
Is there a free trial for Kappino’s restaurant analytics software?
Yes. Every signup includes a 14-day free trial, so you can explore reports, dashboards and the rest of Kappino with your own data.